Warming up the tyres…
Loading…The opponent
The machine you're racing
Every Grand Prix you go head-to-head with a machine-learning model trained on eight seasons of Formula 1. It isn't a gimmick — it's a real forecasting pipeline, deliberately calibrated so the duel is winnable by good play, not luck.
What it thought of Azerbaijan Grand Prix
Ten thousand simulated races, reduced to one number per driver per position: how often they finished there. This is the matrix the whole game runs on — the model plays the top 10 that maximises its own expected score from it, and your rarity multiplier is read straight out of it.
Round 15 · post-quali · Sat 26 Sept
Out of 10,000 simulated races, how often each driver finished P1 — the model played George Russell here.
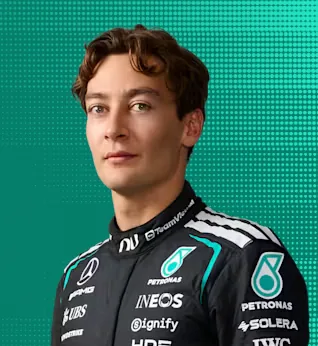 George Russell47%×1
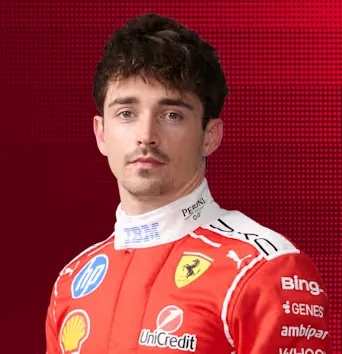 Charles Leclerc23%×1.5
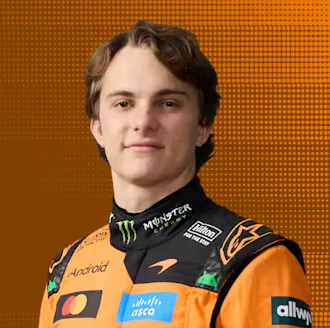 Oscar Piastri12%×2
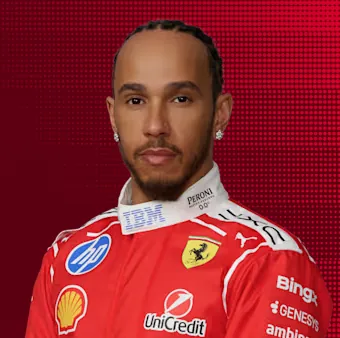 Lewis Hamilton5%×2
 Isack Hadjar4%×3
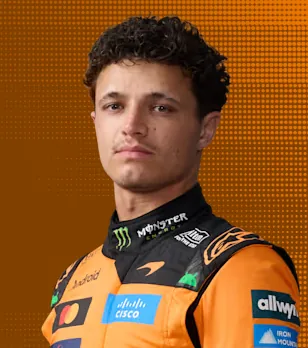 Lando Norris2%×3
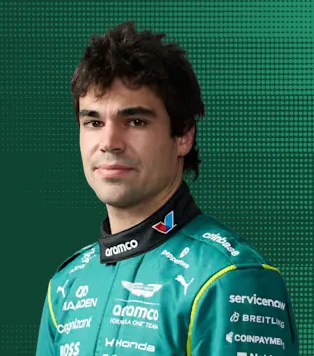 Lance Stroll2%×3
 Valtteri Bottas2%×3
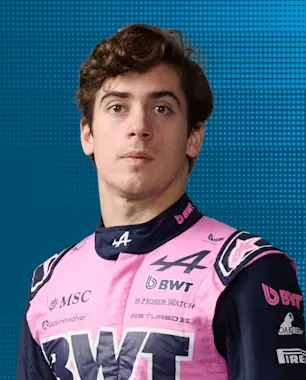 Franco Colapinto1%×3
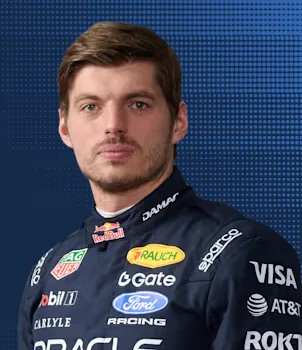 Max Verstappen1%×3
12 more under 1% · ×3 each
How it predicts
Eight seasons in, one top 10 out. Everything in between is narrowing.
seasons
Learn the sport
Every Grand Prix since 2018 — results, grids, pace, weather, reliability — becomes 39 engineered features per driver, per weekend.
models
Two models, one voice
An XGBoost and a LightGBM each score every driver. The blend follows how well each one did on held-out validation races.
simulated races
Run the race, over and over
Those scores plus race-day randomness are Monte-Carlo simulated into one number per driver, per position: how often they finished there.
top 10 played
Play a calibrated hand
The probabilities are blended with a historical grid prior, and the model enters the top 10 that maximises its own expected score.
39 features, six angles
The model doesn't just look at the grid. Each driver's weekend is described from six directions:
Pace & form
recent finishing pace, qualifying gap, rolling results, teammate delta
Car & team
constructor strength, upgrades window, season trajectory
Reliability
DNF history, mechanical-failure rate, finish ratio
Circuit
track type, past results here, overtaking difficulty
Conditions
live weather, rain probability, temperature
Grid
starting position, front-row / points-row odds
Why it's a fair fight
It doesn't just copy the grid
In Formula 1, grid position is a very strong predictor of the finish. A raw model that always plays its most-likely order is easy to tie by copying the grid. So the model's entry is calibrated: its simulated probabilities are blended with a historical P(finish | grid) prior, and it plays the order that maximises its own expected points.
Boldness is your edge
Because the model plays its most likely order, it almost never earns the rarity multiplier. You beat it by finding the correct deviation from the favourites — the upset it didn't dare to call. That asymmetry, not raw accuracy, is the whole game.
Grid-copier vs the model · 2026
Raw model orderThe ensemble's most likely top 10, played as-is
8–0–3
Calibrated entryBlended with the grid prior — what it actually plays
Think you can read a race better?
There's one duel every Grand Prix. Prove it.